| Parameter | Coefficient | SE | CI | CI_low | CI_high | t | df_error | p |
|---|---|---|---|---|---|---|---|---|
| (Intercept) | -5780.83136 | 305.814504 | 0.95 | -6382.35801 | -5179.30471 | -18.90306 | 340 | 0 |
| flipper_length_mm | 49.68557 | 1.518404 | 0.95 | 46.69892 | 52.67221 | 32.72223 | 340 | 0 |
Como Reflectir/Pensar Sobre os Resultados
Desenho Experimental e Análise Avançada de Dados Ecológicos
2025-12-02
Two Key Concepts
Confidence Intervals: Intervals around a parameter estimate, computed as a function of alpha (e.g., α = .05, CI95%) and a test statistic
Effect Sizes: Estimates for the size/magnitude of the effects of each independent variable/predictor
Confidence Intervals
Confidence intervals are generated by a procedure that, for a given α, will generate intervals that include the true population parameter (1 - α) x 100% of the times (e.g., α = .05, 95%).
In 100 studies, we expect that 95 CIs will include the real value of the parameter and that five will not
Important:In each study, a given CI either includes the population parameter or it doesn’t (i.e., 0% or 100%; e.g., after landing a coin is either heads or tails)
Confidence Intervals
- The width of the confidence interval gives an idea of how precise or imprecise is our estimate (the larger the interval, the less precise the estimate, and vice versa).
Confidence Intervals
Confidence intervals come from the same math and philosophy as p-values
For instance, there’s significant evidence a population parameter differs from zero if zero is not included in the interval: e.g., 95%CI = [-3, 3]
Conversely, if zero is not included in the model there is not sufficient evidence to conclude the population parameter differs from zero: e.g., 95%CI = [-3, -1]
One-Hundred 95%CIs
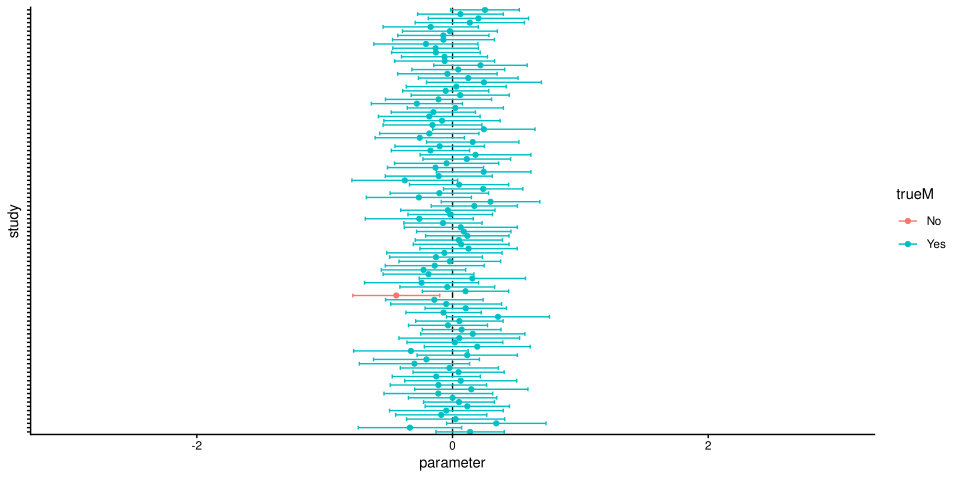
CIs for Model Parameters
Effect Size
Effect size measures try to estimate the magnitued of an effect in the population
-
There are several effect size measures which allow us to compare effect sizes between different studies (e.g., Cohen’s d, Hedge’s g hedges, ω2, etc…)
- Let’s focus on the partial eta squared—ηp2
Partial Eta Squared
\(\eta_{p}^2 = \frac{SSR}{SSE} = \frac{SSE(m0) - SSE(m1)}{SSE(m0)}\)
The same as R^2, but it is computed for each model comparison in the ANOVA table, not just for the comparison of the proposed model with an intercept-only model
If you use
afexit will automatically compute the partial eta squares, for ANOVA models, if you setafex_options(es = "pes").
Partial Eta Squared
library(afex)
library(car)
library(effectsize)
library(palmerpenguins)

# Set options
# Set default contrasts to -1, 0, 1 orthogonal contrasts
options(contrasts = c("contr.sum", "contr.poly"))
# Set default effec stize for ANOVAs to partial eta squared
afex_options(es = "pes")

# Import data
ds <- penguins
# Add id column
ds$id <- seq_len(nrow(ds))
# Fit a simple one_way anova with `lm()`
lm_model <- lm(body_mass_g ~ species, ds)
# Fit a simple one_way anova with `afex()`
afex_model <- aov_4(body_mass_g ~ species + (1 | id), ds)
# Get type III sums of squares ANOVA for lm model
lm_results <- Anova(lm_model, type = 3)
# Get partial eta squared for Anova table
pes <- effectsize(lm_results)
# The effectsize function guesses the measure you want given the model,
# but you can also use the eta_squared function from the same package.
#pes <- eta_squared(lm_model, partial = TRUE)
Partial Eta Squared
Partial Eta Squared
Partial Eta Squared
How to Reflect on Results
Results must be discussed in regard to the research question, previous literature from the field, study design limitations and strengths, competing explanations/hypothesis, and how the study contributes to the field.
Note: For the purposes of the individual assignment you do not need to provide an in-depth discussion regarding previous literature from the field, nor of the study’s contributions to the field
How to Reflect on Results
Each study is different so is each discussion
The structure of the discussion (sections, subsections, etc…) varies more from study to study than the structure of the method section
Still, there are some questions worth asking of every study
How to Reflect on Results
What are the limitations of my study (regarding design, sampling, statistical analysis, etc…) and what are its strengths?
If I had not found the results I was looking for, what flaws would I find in my study?
Given those limitations and strengths which inferences can I be more confident about, and which should I display more uncertainty?
How to Reflect on Results
Was my statistical model a good model for the data?
Looking at the model performance (R^2, graphical exploration of assumptions, etc…) do I see anything that warrants future reflection and/or investigation (e.g., major differences in variability across groups, non-linearity, etc…)?
How to Reflect on Results
Are the predicted results unlikely if my hypothesis is false?
Do competing theories predict the same result I predicted?
Do my measures derive from the theory/ies I tested?
Note: Read about the New Experimentalism, namely, Mayo (1996, 2018)
Goodbye!
Thank you for your participation and effort
Hope you had a good time
= Hope you had an goodok time :)